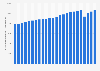
| Characteristic | Consumption in million barrels per day |
|---|---|
| Oct '25 | 8.8 |
| Sep '25 | 8.93 |
| Aug '25 | 8.91 |
| Jul '25 | 9.2 |
| Jun '25 | 8.88 |
| May '25 | 8.92 |
| Apr '25 | 8.6 |
| Mar '25 | 8.69 |
| Feb '25 | 8.32 |
| Jan '25 | 8.65 |
| Dec '24 | 8.62 |
| Nov '24 | 8.86 |
| Oct '24 | 9.04 |
| Sep '24 | 8.98 |
| Aug '24 | 9.11 |
| Jul '24 | 9.29 |
| Jun '24 | 9.11 |
| May '24 | 8.63 |
| Apr '24 | 8.84 |
| Mar '24 | 8.46 |
| Feb '24 | 8.28 |
| Jan '24 | 8.54 |
| Dec '23 | 8.53 |
| Nov '23 | 9 |
| Oct '23 | 8.41 |
| Sep '23 | 9.04 |
| Aug '23 | 8.98 |
| Jul '23 | 9.26 |
| Jun '23 | 9.17 |
| May '23 | 8.99 |
| Apr '23 | 9.08 |
| Mar '23 | 8.72 |
| Feb '23 | 8.28 |
| Jan '23 | 8.28 |
| Dec '22 | 8.44 |
| Nov '22 | 8.82 |
| Oct '22 | 8.72 |
| Sep '22 | 8.78 |
| Aug '22 | 8.86 |
| Jul '22 | 8.98 |
| Jun '22 | 9 |
| May '22 | 8.79 |
| Apr '22 | 8.66 |
| Mar '22 | 8.73 |
| Feb '22 | 8.52 |
| Jan '22 | 8.7 |
The chart is not accessible to screen readers. Please switch to the table view to access the data.
Loading statistic...
Download
Source
Source
Release date
October 2025
More information
Region
United States
Survey time period
January 2022 to October 2025
Special properties
Four week moving average of supplied finished motor gasoline based on the first week of each month
Citation formats