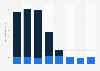
| Characteristic | Percentage of on-time flight operations |
|---|---|
| - | - |
| - | - |
| - | - |
| - | - |
| - | - |
| - | - |
| - | - |
| - | - |
| - | - |
| - | - |
| - | - |
| - | - |
| - | - |
| - | - |
| - | - |
| - | - |
| - | - |
| - | - |
| - | - |
| - | - |
| - | - |
| - | - |
The chart is not accessible to screen readers. Please switch to the table view to access the data.
May 2024
United States
1990 to 2023
* Data include nonstop scheduled service between points within the United States (including territories) by U.S. air carriers with at least 1 percent of the total domestic scheduled service passenger revenues and those carriers that report voluntarily. In 2010, the air carriers were Airtran, Alaska, American, American Eagle, Atlantic Southeast, Comair, Continental, Delta, ExpressJet, Frontier, Hawaiian, JetBlue, Mesa, Pinnacle, Skywest, Southwest, United, and US Airways.
A flight is considered on time if it arrived less than 15 minutes after the scheduled time shown in the carriers' Computerized Reservations Systems. Canceled and diverted operations are counted as late.