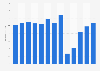
| Characteristic | Admissions to feature film exhibitions | Food and beverage sales | Rental of retail space (concessionaire) | Advertising services | Coin-operated games and rides* | All other operating revenue |
|---|---|---|---|---|---|---|
| - | - | - | - | - | - | - |
| - | - | - | - | - | - | - |
| - | - | - | - | - | - | - |
| - | - | - | - | - | - | - |
| - | - | - | - | - | - | - |
| - | - | - | - | - | - | - |
| - | - | - | - | - | - | - |
| - | - | - | - | - | - | - |
| - | - | - | - | - | - | - |
| - | - | - | - | - | - | - |
| - | - | - | - | - | - | - |
| - | - | - | - | - | - | - |
| - | - | - | - | - | - | - |
The chart is not accessible to screen readers. Please switch to the table view to access the data.
Download
Source
Source
Release date
January 2024
More information
Region
United States
Survey time period
2010 to 2021
Special properties
includes all taxable employer firms
Supplementary notes
* For 2018, the estimated coefficient of聽variation for coin-operated games and rides聽was between 30 and 40 percent. No data available from 2019 to 2021.
Data prior to 2013 was retrieved from earlier releases.
Numbers have been rounded.
Citation formats