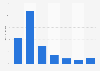
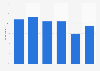
| Characteristic | Enrollment rate |
|---|---|
| 0-1 an | - |
| 2 years | 11.8% |
| 3 years | 97.2% |
| 4 years | 99.6% |
| 5 years | 100% |
| 6 years | 100% |
| 7 years | 100% |
| 8 years | 100% |
| 9 years | 100% |
| 10 years | 100% |
| 11 years | 100% |
| 12 years | 99.5% |
| 13 years old | 99.3% |
| 14 years old | 98.8% |
| 15 years | 98.7% |
| 16 years old | 95.8% |
| 17 years old | 93.3% |
| 18 years old | 79.2% |
| 19 years old | 66.1% |
| 20 years | 55% |
| 21 years old | 44.1% |
| 22 years old | 36.7% |
| 23 years old | 27.6% |
| 24 years old | 18.7% |
| 25 years | 12.3% |
| 26 years old | 8.3% |
| 27 years old | 5.8% |
| 28 years old | 4.3% |
| 29 years old | 3.2% |
| 30 and over | 0.3% |
The chart is not accessible to screen readers. Please switch to the table view to access the data.
Loading statistic...
Download
Source
Sources
Release date
September 2019
More information
Region
France
Survey time period
2017 - 2018
Special properties
Metropolitan France and overseas departments and regions, excluding Mayotte
Supplementary notes
The data include public and private education.
The source adds the following information: "In certain age groups, the observed enrolled population is higher than the total population of the same age estimated from demographic reports. In this case, the enrollment rate is forced to 100 percent. Furthermore, higher education figures are estimated by eliminating duplicate enrollments and continuing education enrollments, so the enrolled population is therefore smaller than that presented on other pages."
Citation formats