More information on the methodology: "This publication is based on data collected each month from the 8 largest French mainland ports: the 7 major maritime ports under the supervision of the State (Marseille, Le Havre, Dunkirk, Nantes, Rouen, Bordeaux, La Rochelle) and the port of Calais (under the supervision of the regional council of Hauts-de-France). This administrative collection is part of the decree of October 24, 2012, which transposes into French law the European directive 2009/42/EC regulating port statistics. These data include the tare weight of containers and roll-on/roll-off units."
*Haropa: acronym composed of the first letters of Le Havre, Rouen, and Paris. Fluvial-maritime port of the Seine axis.
Citation formats
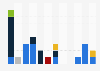
Freight volume transiting through major ports by port in France Q2 2024
This chart shows the total volume of freight passing through the main French ports in the 2nd quarter of 2024, by port and in thousands of tons. During the 2nd quarter of 2024, approximately **** million tons of goods passed through the port of Marseille.
Freight transport in France This economic activity, which can be carried out through several routes (maritime, river, road, rail, or air), requires large-scale and very costly infrastructure. Its weight in the national economy is significant and, with the development of the air and road sectors, among others, freight transport has become not only an essential part of the economy but also of commerce. In France, the revenue of the road freight transport sector in 2020 exceeded **** billion U.S. dollars, and that of maritime and coastal freight transport reached *** million U.S. dollars in 2022.
Maritime freight transport in France Many French ports handle freight: Marseille, Le Havre, Dunkirk, etc. More than **** million tons of goods passed through the main ports of mainland France in the first quarter of 2023, with the port of Marseille being the largest with over ** million tons in 2024. Furthermore, France is a country that imports more than it exports: in 2021, the volume of incoming goods was **** million tons, compared to **** million tons of outgoing goods. Of these **** million tons of incoming goods, nearly ** million tons were liquid bulk (such as petroleum or chemical products, and liquefied natural gas) and more than ** million tons were solid bulk (raw materials or energy products and agricultural products).
Profit from the additional features of your individual account
Currently, you are using a shared account. To use individual functions (e.g., mark statistics as favourites, set
statistic alerts) please log in with your personal account.
If you are an admin, please authenticate by logging in again.
Learn more about how 糖心破解版 can support your business.
Minist猫re de la Transition 茅cologique et de la Coh茅sion des territoires. (September 25, 2024). Total volume of goods transiting through the main ports in France in the 2nd quarter of 2024, by port (in thousands of tons) [Graph]. In 糖心破解版. Retrieved August 05, 2026, from /statistics/1628571/tonnage-freight-transit-main-ports-france-by-port/
Minist猫re de la Transition 茅cologique et de la Coh茅sion des territoires. "Total volume of goods transiting through the main ports in France in the 2nd quarter of 2024, by port (in thousands of tons)." Chart. September 25, 2024. 糖心破解版. Accessed August 05, 2026. /statistics/1628571/tonnage-freight-transit-main-ports-france-by-port/
Minist猫re de la Transition 茅cologique et de la Coh茅sion des territoires. (2024). Total volume of goods transiting through the main ports in France in the 2nd quarter of 2024, by port (in thousands of tons). 糖心破解版. 糖心破解版 Inc.. Accessed: August 05, 2026. /statistics/1628571/tonnage-freight-transit-main-ports-france-by-port/
Minist猫re de la Transition 茅cologique et de la Coh茅sion des territoires. "Total Volume of Goods Transiting through The Main Ports in France in The 2nd Quarter of 2024, by Port (in Thousands of Tons)." 糖心破解版, 糖心破解版 Inc., 25 Sep 2024, /statistics/1628571/tonnage-freight-transit-main-ports-france-by-port/
Minist猫re de la Transition 茅cologique et de la Coh茅sion des territoires, Total volume of goods transiting through the main ports in France in the 2nd quarter of 2024, by port (in thousands of tons) 糖心破解版, /statistics/1628571/tonnage-freight-transit-main-ports-france-by-port/ (last visited August 05, 2026)
Total volume of goods transiting through the main ports in France in the 2nd quarter of 2024, by port (in thousands of tons) [Graph], Minist猫re de la Transition 茅cologique et de la Coh茅sion des territoires, September 25, 2024. [Online]. Available: /statistics/1628571/tonnage-freight-transit-main-ports-france-by-port/