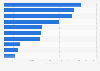
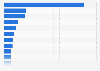
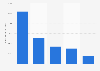
| Characteristic | Once a month | Once every two to three weeks | At least once per week |
|---|---|---|---|
| Fast Food/Burger | 36% | 21% | 17% |
| Bakery/Sandwich Shop | 24% | 24% | 24% |
| Pizzeria | 34% | 19% | 11% |
| Tacos/Kebabs | 30% | 22% | 14% |
| Coffee chains | 23% | 25% | 22% |
The chart is not accessible to screen readers. Please switch to the table view to access the data.
Loading statistic...
Download
Source
Sources
Release date
October 2024
More information
Region
France
Survey time period
May 23 - 28, 2024
Number of respondents
1,084 respondents
Age group
18 years and older
Method of interview
Online survey
Supplementary notes
This question was formulated by the source as follows: "Over the past 12 months, on average, how often do you visit these types of fast food establishments, whether to dine in, have food delivered, or buy takeout?"
The question was asked to those who have consumed fast food in the past 12 months.
Citation formats