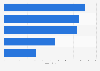
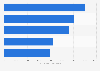
| Characteristic | In France | Abroad | In France and abroad the same year |
|---|---|---|---|
| 2010 | 43.4% | 6.1% | 13.9% |
| 2011 | 43.4% | 6.4% | 14% |
| 2012 | 44.75% | 6.69% | 14.05% |
| 2013 | 43.92% | 7.03% | 14.84% |
| 2014 | 43.02% | 7.27% | 15.09% |
| 2015 | 43.06% | 7.22% | 14.74% |
| 2016 | 41.18% | 7.44% | 14.44% |
| 2017 | 36.04% | 7.27% | 14.04% |
| 2018 | 36.01% | 7.13% | 15.62% |
| 2019 | 35.49% | 7.87% | 15.06% |
| 2020 | 50.49% | 3.25% | 5.66% |
| 2021 | 52.18% | 4.07% | 7.19% |
| 2022 | 43.62% | 7.16% | 11.82% |
| 2023 | 43.61% | 8.36% | 15.12% |
The chart is not accessible to screen readers. Please switch to the table view to access the data.
Loading statistic...
Download
Source
Source
Release date
February 2025
More information
Region
France
Survey time period
2010 - 2023
Special properties
4 nights and more
Supplementary notes
The source adds the following information: "The data are collected by the competent national authorities of the Member States and compiled according to a harmonized methodology established by EU regulations before being transmitted to Eurostat. In most cases, data on domestic and outbound travel (with 'outbound tourism' meaning that residents of one country travel to another country) are collected through survey sampling. However, in some cases, the data are compiled from border surveys. The surveys are generally conducted on a monthly or quarterly basis.
Citation formats