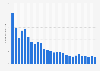

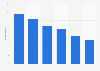
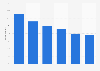

| Characteristic | Revenue in million U.S. dollars |
|---|---|
| - | - |
| - | - |
| - | - |
| - | - |
| - | - |
| - | - |
| - | - |
| - | - |
| - | - |
| - | - |
| - | - |
| - | - |
| - | - |
| - | - |
| - | - |
| - | - |
| - | - |
| - | - |
| - | - |
| - | - |
| - | - |
| - | - |
| - | - |
| - | - |
| - | - |
| - | - |
| - | - |
The chart is not accessible to screen readers. Please switch to the table view to access the data.
Download
Source
Source
In cooperation with
AppMagic
Release date
July 2025
More information
Region
Worldwide
Survey time period
April 2023 to June 2025
Special properties
Google Play and Apple App Store; IAP revenue reduced by platform fees and including taxes
Supplementary notes
Citation formats



