| Characteristic | 2011 | 2022 |
|---|---|---|
| - | - | - |
| - | - | - |
| - | - | - |
| - | - | - |
| - | - | - |
| - | - | - |
| - | - | - |
| - | - | - |
| - | - | - |
The chart is not accessible to screen readers. Please switch to the table view to access the data.
Download
Source
Source
Release date
October 2024
More information
Region
Africa, South Africa
Survey time period
2011 and 2022
Supplementary notes
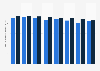
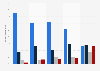
The source states the following: "The WIQI is calculated by categorizing the quality of infrastructure according to five levels (namely: no service, minimum, basic, intermediate and full service) that are each categorized by numerical values between 1 and 5 based on the level of service, one being the lowest (no service) and five the highest (piped water in the dwelling)."
Citation formats