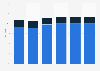
| Characteristic | Ratio between the richest to the poorest incomes |
|---|---|
| - | - |
| - | - |
| - | - |
| - | - |
| - | - |
| - | - |
| - | - |
| - | - |
| - | - |
| - | - |
| - | - |
| - | - |
| - | - |
| - | - |
| - | - |
| - | - |
| - | - |
| - | - |
| - | - |
| - | - |
| - | - |
| - | - |
| - | - |
| - | - |
| - | - |
| - | - |
| - | - |
| - | - |
| - | - |
| - | - |
| - | - |
| - | - |
The chart is not accessible to screen readers. Please switch to the table view to access the data.
Download
Source
Source
Release date
July 2024
More information
Region
France
Survey time period
1970 to 2022
Supplementary notes
The source adds the following information: the ratio between the richest to the poorest incomes also called the "inter-decile ratio" offers a limited view of inequalities. Indeed, this indicator does not take into account changes in the income of the very rich, those well above the threshold of the wealthiest 10 percent. For example, if only the richest 1% becomes richer, the ratio does not change.
*between 1970 and 1990: old series (excluding financial income)
Citation formats