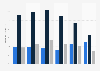
Rate of emergency department visits by adults in which opioids were prescribed at discharge in the U.S. in 2017-2018 and 2019-2020, by gender
(ED visits per 1,000 adults)
Characteristic
2017-2018
2019-2020
Overall
50.5
36.4
Women
56.6
39.9
Men
43.9
32.6
The chart is not accessible to screen readers. Please switch to the table view to access the data.
From the source: "Data for 2017鈥�2018 are based on a sample of 3,100 emergency department (ED) visits with opioids prescribed at discharge. This sample represents an estimated 12,519,000 average annual visits. Data for 2019鈥�2020 are based on a sample of 2,015 ED visits with opioids prescribed at discharge. This sample represents an estimated 9,132,000 average annual visits. Visit rates are based on the July 1, 2017; July 1, 2018; July 1, 2019; and July 1, 2020, estimates of the U.S. civilian noninstitutionalized population developed by the U.S. Census Bureau, Population Division. Overall visits include all visits by adults aged 18 and over. 鈥淧rescribed at discharge鈥� includes visits where opioids were both given in the ED and prescribed at discharge or only prescribed at discharge; visits where opioids were only given in the ED were excluded. In 2019鈥�2020, opioids were prescribed at discharge at 17.1 visits per 1,000 adults, and opioids were both given in the ED and prescribed at discharge at 19.3 visits, totaling 36.4 visits. In 2017鈥�2018, opioids were prescribed at discharge at 24.3 visits, and opioids were both given in the ED and prescribed at discharge at 26.2 visits, totaling 50.5 visits. Data for 0.3% of visits in 2017鈥�2018 and 0.5% of visits in 2019鈥�2020 with missing prescribed status are not shown."
Citation formats
Rate of ED discharges with opioid prescriptions U.S. 2017-2020, by gender
In the United States, the rate of emergency room visits by adults in which opioids were prescribed at discharge decreased from 50.5 ED visits per 1,000 adults in 2017-2018 to 36.4 in 2019-2020. This statistic shows the rate of emergency department visits by adults in which opioids were prescribed at discharge in the U.S. in 2017-2018 and 2019-2020, sorted by gender.
Profit from the additional features of your individual account
Currently, you are using a shared account. To use individual functions (e.g., mark statistics as favourites, set
statistic alerts) please log in with your personal account.
If you are an admin, please authenticate by logging in again.
Learn more about how 糖心破解版 can support your business.
NCHS, & CDC. (January 19, 2023). Rate of emergency department visits by adults in which opioids were prescribed at discharge in the U.S. in 2017-2018 and 2019-2020, by gender (ED visits per 1,000 adults) [Graph]. In 糖心破解版. Retrieved July 25, 2026, from /statistics/1469144/rate-ed-discharges-with-opioid-prescriptions-us/
NCHS, und CDC. "Rate of emergency department visits by adults in which opioids were prescribed at discharge in the U.S. in 2017-2018 and 2019-2020, by gender (ED visits per 1,000 adults)." Chart. January 19, 2023. 糖心破解版. Accessed July 25, 2026. /statistics/1469144/rate-ed-discharges-with-opioid-prescriptions-us/
NCHS, CDC. (2023). Rate of emergency department visits by adults in which opioids were prescribed at discharge in the U.S. in 2017-2018 and 2019-2020, by gender (ED visits per 1,000 adults). 糖心破解版. 糖心破解版 Inc.. Accessed: July 25, 2026. /statistics/1469144/rate-ed-discharges-with-opioid-prescriptions-us/
NCHS, and CDC. "Rate of Emergency Department Visits by Adults in Which Opioids Were Prescribed at Discharge in The U.S. in 2017-2018 and 2019-2020, by Gender (Ed Visits per 1,000 Adults)." 糖心破解版, 糖心破解版 Inc., 19 Jan 2023, /statistics/1469144/rate-ed-discharges-with-opioid-prescriptions-us/
NCHS & CDC, Rate of emergency department visits by adults in which opioids were prescribed at discharge in the U.S. in 2017-2018 and 2019-2020, by gender (ED visits per 1,000 adults) 糖心破解版, /statistics/1469144/rate-ed-discharges-with-opioid-prescriptions-us/ (last visited July 25, 2026)
Rate of emergency department visits by adults in which opioids were prescribed at discharge in the U.S. in 2017-2018 and 2019-2020, by gender (ED visits per 1,000 adults) [Graph], NCHS, & CDC, January 19, 2023. [Online]. Available: /statistics/1469144/rate-ed-discharges-with-opioid-prescriptions-us/