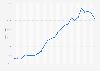
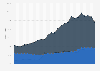
| Characteristic | Debt to GDP ratio |
|---|---|
| - | - |
| - | - |
| - | - |
| - | - |
| - | - |
| - | - |
| - | - |
| - | - |
| - | - |
| - | - |
| - | - |
| - | - |
| - | - |
| - | - |
| - | - |
| - | - |
| - | - |
| - | - |
| - | - |
| - | - |
| - | - |
| - | - |
| - | - |
| - | - |
| - | - |
The chart is not accessible to screen readers. Please switch to the table view to access the data.
June 2025
China
2000 to 2024
Figures do not include financial sector debt.
Values are based on core credit, and capture the outstanding amount of credit at the end of each year. In terms of financial instruments, credit covers the core debt, defined as loans, debt securities and currency & deposits.
In 2024, BIS re-estimated total credit to non-financial corporations for China to remove LGFVs (Local Government Financing Vehicles) included under government sector. As a result, the figure for total credit to the non鈥慺inancial sector in 2022 has been revised fom 297.2 percent to 271.3 percent.聽
In 2025, BIS revised figures for China's GDP across the whole timeline, resulting in overall slightly lower values of total credit to the non-financial sector as GDP share.