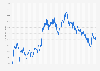
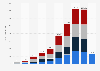
| Characteristic | Average uptime of supercharger sites |
|---|---|
| - | - |
| - | - |
| - | - |
| - | - |
| - | - |
| - | - |
| - | - |
The chart is not accessible to screen readers. Please switch to the table view to access the data.
Download
Source
Source
Release date
July 2026
More information
Region
Worldwide
Survey time period
2018 to 2024
Supplementary notes
A charger's uptime refects to the average percentage of sites which had at least 50 percent of their daily capacity functional for the year.
Figures prior to 2019 were retrieved from earlier impact reports published by the source.
Citation formats