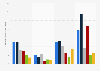
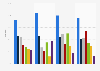
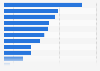
| Characteristic | Share of shopping tourists |
|---|---|
| - | - |
| - | - |
| - | - |
| - | - |
| - | - |
| - | - |
| - | - |
| - | - |
| - | - |
| - | - |
| - | - |
| - | - |
| - | - |
| - | - |
| - | - |
| - | - |
| - | - |
| - | - |
| - | - |
| - | - |
| - | - |
| - | - |
| - | - |
| - | - |
| - | - |
| - | - |
| - | - |
| - | - |
| - | - |
| - | - |
The chart is not accessible to screen readers. Please switch to the table view to access the data.
Download
Source
Source
Release date
July 2023
More information
Region
Worldwide
Survey time period
June 2023
Special properties
consumers who plan to take leisure trips domestically and/or abroad in 2023
Supplementary notes
Data refer to the share of respondents who said that shopping is the main reason for traveling. The source did not specify the number of respondents.
Citation formats