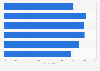
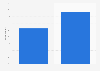
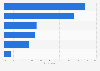
| Characteristic | Share of respondents |
|---|---|
| - | - |
| - | - |
| - | - |
| - | - |
| - | - |
| - | - |
| - | - |
| - | - |
| - | - |
| - | - |
| - | - |
| - | - |
| - | - |
| - | - |
| - | - |
| - | - |
| - | - |
| - | - |
| - | - |
| - | - |
| - | - |
The chart is not accessible to screen readers. Please switch to the table view to access the data.
Download
Source
Sources
Release date
May 2025
More information
Region
Worldwide, South Korea
Survey time period
every month in 2024
Number of respondents
16,216 respondents
Age group
15 years and older
Special properties
among people who visited for up to 90 days
Method of interview
Computer-assisted personal interviews (CAPI)
Supplementary notes
Respondent count by origin was as follows:
China: 2,215
Russia: 425
Japan: 2,007
Thailand: 648
Indonesia: 536
Singapore: 687
Vietnam: 769
Taiwan: 1,300
Hong Kong: 834
Malaysia: 606
Middle East: 644
Philippines: 621
Mongolia: 419
India: 347
Other: 607
Canada: 538
Australia: 530
France: 451
United States: 1,192
Germany: 423
United Kingdom: 419
Citation formats