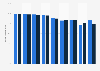
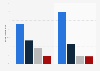
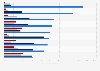
| Characteristic | Share of drinking water samples with PFAS detection |
|---|---|
| - | - |
| - | - |
| - | - |
The chart is not accessible to screen readers. Please switch to the table view to access the data.
Download
Source
Sources
Release date
July 2023
More information
Region
United States
Survey time period
2016 to 2021
Number of respondents
716 samples*
Supplementary notes
*Tap water from 716 locations (269 private-wells; 447 public supply) across the U.S. was collected during 2016 and 2021 including three locations where temporal sampling was conducted.
Citation formats