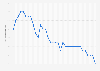
| Characteristic | General government expenditure in billion U.S. dollars |
|---|---|
| 2031 | 137.1 |
| 2030 | 129.7 |
| 2029 | 123.94 |
| 2028 | 117.77 |
| 2027 | 112.53 |
| 2026 | 107.47 |
| 2025 | 100.51 |
| 2024 | 93.92 |
| 2023 | 87.07 |
| 2022 | 79.28 |
| 2021 | 90.75 |
| 2020 | 66.01 |
| 2019 | 58.42 |
| 2018 | 54.72 |
| 2017 | 51.55 |
| 2016 | 48.27 |
| 2015 | 44.77 |
| 2014 | 39.79 |
| 2013 | 35.79 |
| 2012 | 33.84 |
| 2011 | 31.36 |
| 2010 | 29.31 |
| 2009 | 27.08 |
| 2008 | 23.07 |
| 2007 | 19.63 |
| 2006 | 17.23 |
| 2005 | 15.63 |
| 2004 | 14.18 |
| 2003 | 13.25 |
| 2002 | 12.67 |
| 2001 | 11.87 |
| 2000 | 10.89 |
| 1999 | 10.28 |
| 1998 | 9.32 |
| 1997 | 8.34 |
| 1996 | 7.54 |
| 1995 | 6.44 |
| 1994 | 5.61 |
| 1993 | 4.8 |
| 1992 | 3.96 |
| 1991 | 3.19 |
| 1990 | 2.39 |
The chart is not accessible to screen readers. Please switch to the table view to access the data.
Loading statistic...
Download
Source
Source
Release date
December 2025
More information
Region
Chile
Survey time period
1990 to 2031
Supplementary notes
The raw data were provided in the national currency. For display in U.S. Dollars the following exchange rate was applied:
1 U.S. Dollar = 886.823406 Chilean pesos (as of December 31, 2024)
Data were estimated for: 2027, 2028, 2029, 2030, and 2031.
Citation formats