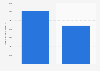
| Characteristic | Share of people |
|---|---|
| - | - |
| - | - |
| - | - |
| - | - |
| - | - |
| - | - |
| - | - |
| - | - |
| - | - |
| - | - |
| - | - |
| - | - |
| - | - |
| - | - |
| - | - |
| - | - |
| - | - |
| - | - |
The chart is not accessible to screen readers. Please switch to the table view to access the data.
Download
Source
Source
Release date
February 2020
More information
Region
Australia
Survey time period
2018
Supplementary notes
Notes from source:
1. Components will not add to total as people may report impairments related to more than one disability type. In such cases, people are counted separately for each disability type but are only counted once in the aggregated total.
2. Figures are rounded and components may not add to total because of ABS confidentiality and perturbation processes. Due to these processes, figures may differ from those published by the ABS and across tables.
Citation formats