| Characteristic | PBT in million GBP |
|---|---|
| - | - |
| - | - |
| - | - |
| - | - |
| - | - |
| - | - |
| - | - |
The chart is not accessible to screen readers. Please switch to the table view to access the data.
Download
Source
Source
Release date
August 2024
More information
Region
United Kingdom
Survey time period
2017-2024
Special properties
Financial year ends in March 31
Supplementary notes
Figures preceding 2022/23 were taken from earlier editions of the report聽
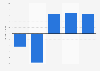
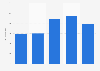
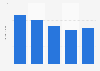
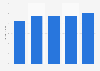
The source states that in the most and preceding fiscal years, the company achieved operating profits of approximately three billion British pounds. The source attributes the decline in profitability, as shown in the graph, to an additional 拢1.4 billion in indexation uplift when valuing the legacy RPI-linked debt. This increase in the value of its debt, is a consequence of significantly higher inflation than the previous year.
Citation formats