

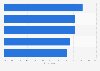
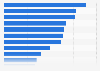

| Characteristic | Net difference of share of companies expecting each skill to rise from 2023 to 2027 |
|---|---|
| - | - |
| - | - |
| - | - |
| - | - |
| - | - |
| - | - |
| - | - |
| - | - |
| - | - |
| - | - |
| - | - |
| - | - |
| - | - |
| - | - |
| - | - |
| - | - |
| - | - |
| - | - |
| - | - |
| - | - |
| - | - |
| - | - |
| - | - |
| - | - |
| - | - |
| - | - |
The chart is not accessible to screen readers. Please switch to the table view to access the data.
Download
Source
Source
Release date
April 2023
More information
Region
Worldwide
Survey time period
November 2022 - February 2023
Number of respondents
803 global companies
Special properties
Responses represent over 11.3 million employees worldwide.
Method of interview
Questionnaire
Supplementary notes
The net difference is equivalent to the subtraction of the share of companies that expect each skill to decrease importance from the share of companies that expect them to increase in the next five years.
Citation formats



