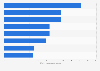
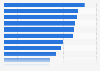
| Characteristic | 2021 | 2022 |
|---|---|---|
| - | - | - |
| - | - | - |
| - | - | - |
| - | - | - |
| - | - | - |
| - | - | - |
| - | - | - |
| - | - | - |
| - | - | - |
The chart is not accessible to screen readers. Please switch to the table view to access the data.
Download
Source
Sources
Release date
January 2023
More information
Region
United States
Survey time period
September 12 to 20, 2022
Number of respondents
600 respondents
Special properties
full service restaurant owners, presidents, and area/general managers
Supplementary notes
Data collected by the source across all 50 states with an added focus on six key cities: New York City, Los Angeles, Chicago, Dallas, Houston, and Miami.
Citation formats