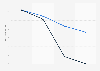
| Characteristic | Share of the global fleet |
|---|---|
| - | - |
| - | - |
| - | - |
| - | - |
| - | - |
| - | - |
The chart is not accessible to screen readers. Please switch to the table view to access the data.
Download
Source
Sources
Release date
November 2022
More information
Region
Worldwide
Survey time period
2019
Supplementary notes
Includes 29,928 cargo-carrying or passenger ships above 5,000 GT.
A ship usually calls in ports in different countries or regions during its voyage, leading to a major overlap. Shares for individual countries can thus not be substracted from the totals shown in the graph. For example: a share for China cannot be found by substracting EU's share (42 percent) from the combined EU and China's share (80 percent).
Citation formats