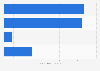
| Characteristic | Favorable | Unfavorable |
|---|---|---|
| Christianity | 51% | 18% |
| Catholicism | 34% | 24% |
| Protestantism | 31% | 16% |
| Buddhism | 31% | 20% |
| Amish | 27% | 16% |
| Judaism | 27% | 17% |
| Presbyterianism | 25% | 18% |
| Methodism | 23% | 19% |
| Lutheranism | 23% | 18% |
| The Church of God in Christ | 23% | 19% |
| The Episcopal Church | 22% | 19% |
| Orthodox Judaism | 22% | 19% |
| The Southern Baptist Convention | 22% | 27% |
| Pentecostalism | 21% | 23% |
| Atheism | 21% | 33% |
| The Assemblies of God | 20% | 19% |
| Anglicanism | 20% | 18% |
| Agnostics | 20% | 24% |
| The National Baptist Convention | 20% | 26% |
| Hinduism | 19% | 19% |
| The Eastern Orthodox Church | 18% | 17% |
| The Mennonite Church | 18% | 16% |
| The Seventh-Day Adventist Church | 17% | 30% |
| Mormonism | 17% | 39% |
| Christian Science | 16% | 37% |
| Wicca | 15% | 31% |
| Unitarian Universalism | 14% | 24% |
| Fundamentalist Mormonism | 14% | 41% |
| Islam | 13% | 37% |
| Bah谩鈥櫭� Faith | 13% | 19% |
| Sikhs | 12% | 20% |
| Jehovah鈥檚 Witnesses | 12% | 44% |
| Scientology | 11% | 59% |
| Satanism | 10% | 58% |
| Falun Gong | 8% | 17% |
The chart is not accessible to screen readers. Please switch to the table view to access the data.
Loading statistic...
Download
Source
Source
Release date
December 2022
More information
Region
United States
Survey time period
November 22 to November 26, 2022
Number of respondents
1,000 respondents
Age group
18 years and older
Method of interview
Online interview
Supplementary notes
Responses were originally split as "very favorable" and "somewhat favorable", or "very unfavorable", and "somewhat unfavorable" - these have been combined for display purposes. Many respondents also answered "neither favorable or unfavorable" or "not sure" - these have not been included.
Citation formats