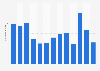
| Characteristic | 2021 | 2022 | 2023 |
|---|---|---|---|
| Manufactured goods | 78.99 | 46.23 | 30.86 |
| Chemicals and related products, n.e.s. | 20.01 | 18.24 | 14.82 |
| Other manufactured goods | 19.54 | 11.88 | 8.8 |
| Machinery and transport equipment | 39.44 | 16.12 | 7.23 |
| Food, drinks, and tobacco | 5.78 | 5.77 | 6.38 |
| Miscellaneous manufactured articles | 10.53 | 6.74 | 5.82 |
| Food and live animals | 3.99 | 3.94 | 3.6 |
| Manufactured goods classified chiefly by material | 9 | 5.13 | 2.98 |
| Beverages and tobacco | 1.79 | 1.83 | 2.21 |
| Raw materials | 2.64 | 2.28 | 1.47 |
| Crude materials, inedible, except fuels | 2.46 | 2.14 | 1.34 |
| Commodities and transactions not classified elsewhere in the SITC | 0.99 | 0.39 | 0.16 |
| Animal and vegetable oils, fats, and waxes | 0.18 | 0.15 | 0.13 |
| Mineral fuels, lubricants, and related materials | 0.79 | 0.49 | 0.04 |
| Petroleum, petroleum products, and related materials | 0.72 | 0.42 | 0.02 |
The chart is not accessible to screen readers. Please switch to the table view to access the data.
Loading statistic...
Download
Source
Source
Release date
May 2024
More information
Region
EU
Survey time period
2021 to 2023
Supplementary notes
The product categories are based on the Standard International Trade Classification (SITC).
Citation formats