| Characteristic | Share of respondents |
|---|---|
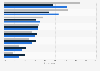
| A Charlie Brown Christmas | 52% |
| It鈥檚 a Wonderful Life | 51% |
| How the Grinch Stole Christmas | 48% |
| White Christmas | 47% |
| Christmas Vacation | 45% |
| The Grinch | 45% |
| A Christmas Carol | 45% |
| Rudolph the Red-Nosed Reindeer | 45% |
| Home Alone | 43% |
| Die Hard | 43% |
| Return to Christmas Creek | 43% |
| Little Women | 42% |
| Miracle on 34th Street | 42% |
| The Santa Clause | 40% |
| The Christmas Chronicles | 39% |
| Happiest Season | 39% |
| Frosty the Snowman | 39% |
| Elf | 38% |
| Love Hard | 38% |
| The Muppet Christmas Carol | 38% |
The chart is not accessible to screen readers. Please switch to the table view to access the data.
Loading statistic...
Download
Source
Source
In cooperation with
YouGov
Release date
December 2022
More information
Region
United States
Survey time period
December 2 to 8, 2022
Number of respondents
2,000 respondents
Age group
18 years and older
Method of interview
Online interview
Supplementary notes
Original question: What is your opinion of the following movie?
Respondents could answer "love it," "like it," "dislike it," "hate it," or "not sure."
This statistic reflects the share of respondents who said they "love it."
Citation formats