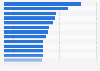
| Characteristic | Price level index (OECD=100) |
|---|---|
| 2023 | 53 |
| 2022 | 53 |
| 2021 | 54 |
| 2020 | 53 |
| 2019 | 53 |
| 2018 | 55 |
| 2017 | 53 |
| 2016 | 51 |
| 2015 | 53 |
| 2014 | 58 |
| 2013 | 57 |
| 2012 | 55 |
| 2011 | 58 |
| 2010 | 59 |
| 2009 | 59 |
| 2008 | 72 |
| 2007 | 65 |
| 2006 | 60 |
| 2005 | 57 |
| 2004 | 49 |
| 2003 | 48 |
| 2002 | 49 |
| 2001 | 50 |
| 2000 | 45 |
| 1999 | 45 |
| 1998 | 49 |
| 1997 | 46 |
The chart is not accessible to screen readers. Please switch to the table view to access the data.
Zoomable Statistic: Select the range in the chart you want to zoom in on.
Loading statistic...
Download
Source
Source
Release date
February 2025
More information
Region
Poland
Survey time period
1997 to 2023
Supplementary notes
The source adds the following information: "Comparative price level indices are the ratios of purchasing power parities to market exchange rates. At the level of GDP, comparative price levels provide a measure of the differences in the general price levels of countries."
Citation formats