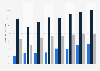
| Job position | Partners | Associates | All other lawyers |
|---|---|---|---|
| - | - | - | - |
| - | - | - | - |
| - | - | - | - |
| - | - | - | - |
| - | - | - | - |
| - | - | - | - |
| - | - | - | - |
The chart is not accessible to screen readers. Please switch to the table view to access the data.
Download
Source
Source
Release date
October 2023
More information
Region
United States
Survey time period
2023
Supplementary notes
Figures used in this chart are based on a total headcount by Linklaters LLP.
The percentage ratio may not add up to 100 percent owing to rounding of figures.
"Other" refers to jobs not listed here but employees still on the payroll of Linklaters, as well as knowledge lawyers. Data presented here reflects the demographic information of members in the Americas region and to members of the Global US Practice.
Data is representative of 100 percent of all legal staff working for Linklaters In the United States.
Citation formats