| Characteristic | Share of total fertilizer imports |
|---|---|
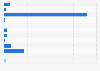
| Hong Kong | 99.01% |
| Belarus | 97.23% |
| Mongolia | 96% |
| Azerbaijan | 90.11% |
| Estonia | 90.07% |
| Nigeria | 87.51% |
| Benin | 84.15% |
| Moldova | 82.17% |
| Kazakhstan | 80.41% |
| Finland | 70.68% |
| Latvia | 66.07% |
| Georgia | 63.75% |
| Kyrgyzstan | 59.42% |
| Liberia | 57.23% |
| Peru | 53.2% |
| Armenia | 47.61% |
| Honduras | 43.62% |
| Serbia | 42.12% |
| Uzbekistan | 40.64% |
| India | 38.7% |
The chart is not accessible to screen readers. Please switch to the table view to access the data.
Loading statistic...
Download
Source
Sources
Release date
June 2022
More information
Region
Worldwide, Russia
Survey time period
as of June 2022
Supplementary notes
The source specified the following information: "Note: Fertilizers correspond to the aggregation of five products defined at the HS 6-digit level as follows: nitrogenous fertilizers (HS310280), fertilizers containing nitrogen, phosphorus and potassium (HS310520), fertilizers containing mono-ammonium phosphate and di-ammonium phosphate (HS310540), fertilizers containing nitrates and phosphates (HS310551) and fertilizers, mineral or chemical (HS310230)."
Citation formats