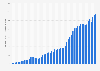
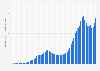
| Characteristic | Top 10% | Bottom 50% | Top 1% |
|---|---|---|---|
| 2023 | 34.17% | 21.23% | 12.1% |
| 2022 | 34.17% | 21.23% | 12.1% |
| 2021 | 34.17% | 21.23% | 12.1% |
| 2020 | 34.17% | 21.23% | 12.1% |
| 2019 | 34.17% | 21.23% | 12.1% |
| 2018 | 34.66% | 21.06% | 12.55% |
| 2017 | 35.08% | 20.63% | 12.72% |
| 2016 | 35.12% | 20.23% | 12.71% |
| 2015 | 35.34% | 20.36% | 12.66% |
| 2014 | 34.91% | 20.53% | 12.18% |
| 2013 | 34.72% | 20.61% | 12.07% |
| 2012 | 34.64% | 20.86% | 12.14% |
| 2011 | 34.07% | 20.65% | 11.35% |
| 2010 | 34.33% | 20.62% | 11.54% |
| 2009 | 35.87% | 19.95% | 12.62% |
| 2008 | 34.77% | 20.42% | 11.61% |
| 2007 | 34.56% | 20.34% | 11.31% |
| 2006 | 34.7% | 20.31% | 11.31% |
| 2005 | 33.8% | 20.71% | 10.86% |
| 2004 | 34.06% | 20.3% | 10.99% |
| 2003 | 34.25% | 20.4% | 11.12% |
| 2002 | 33.94% | 20.45% | 10.88% |
| 2001 | 33.65% | 20.58% | 10.57% |
| 2000 | 34.27% | 20.28% | 11.02% |
| 1999 | 34.59% | 20.02% | 11.15% |
The chart is not accessible to screen readers. Please switch to the table view to access the data.
Zoomable Statistic: Select the range in the chart you want to zoom in on.
Loading statistic...
Download
Source
More information
Region
Spain
Survey time period
1999 to 2022
Age group
over 20
Supplementary notes
Pre-tax national income is the sum of all pre-tax personal income flows accruing to the owners of the production factors, labor and capital, before taking into account the operation of the tax/transfer system, but after taking into account the operation of pension system.
The base unit is the individual (rather than the household) but resources are split equally within couples.
Date of release is the date of access.
Citation formats