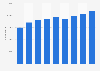
| Characteristic | Sales DI |
|---|---|
| - | - |
| - | - |
| - | - |
| - | - |
| - | - |
| - | - |
| - | - |
| - | - |
| - | - |
| - | - |
| - | - |
| - | - |
| - | - |
| - | - |
| - | - |
| - | - |
| - | - |
| - | - |
| - | - |
| - | - |
| - | - |
| - | - |
| - | - |
| - | - |
| - | - |
| - | - |
| - | - |
| - | - |
| - | - |
| - | - |
| - | - |
| - | - |
| - | - |
| - | - |
| - | - |
| - | - |
| - | - |
| - | - |
| - | - |
| - | - |
| - | - |
| - | - |
| - | - |
| - | - |
| - | - |
| - | - |
| - | - |
| - | - |
| - | - |
| - | - |
| - | - |
| - | - |
| - | - |
| - | - |
| - | - |
| - | - |
| - | - |
| - | - |
| - | - |
| - | - |
| - | - |
| - | - |
| - | - |
| - | - |
| - | - |
| - | - |
| - | - |
| - | - |
| - | - |
| - | - |
| - | - |
| - | - |
| - | - |
| - | - |
| - | - |
| - | - |
| - | - |
| - | - |
| - | - |
| - | - |
The chart is not accessible to screen readers. Please switch to the table view to access the data.
September 2025
Japan
January 2019 to August 2025
1,275 enterprises*
seasonally adjusted; micro and small businesses; among customers of Japan Finance Corporation
*Number of respondents in latest survey.
Definition of micro and small enterprises:
Manufacturing: less than 20 workers
Wholesale trade: less than 10 workers
Retail trade: less than 10 workers
Restaurants: less than 10 workers
Services: less than 20 workers
Construction: less than 20 workers
Transport: less than 20 workers
Workers include employees and entrepreneurs/CEOs
Responses are weighted by industry and by region according to the "Economic Census" by the Statisics Bureau of Japan.
Original question: "How are your sales compared with those of the same month of the last year?"
DI = percentage of those answering "increase" minus percentage of those answering "decrease".
Data prior to February 2024 come from previous reports.