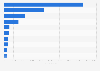
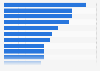
| Characteristic | 16 to 24 years | 25 to 34 years | 35 to 44 years | 45 to 54 years | 55 years and above |
|---|---|---|---|---|---|
| - | - | - | - | - | - |
| - | - | - | - | - | - |
| - | - | - | - | - | - |
| - | - | - | - | - | - |
| - | - | - | - | - | - |
| - | - | - | - | - | - |
| - | - | - | - | - | - |
The chart is not accessible to screen readers. Please switch to the table view to access the data.
Download
Source
Source
In cooperation with
Rakuten Insight
Release date
May 2023
More information
Region
China
Survey time period
April 13 to 30, 2023
Number of respondents
8,329 respondents
Age group
16 years and older
Special properties
among 4,911 female and 3,418 male respondents
Method of interview
Online survey
Supplementary notes
Survey question:
"How often do you order from food delivery apps?"
The survey was conducted among
1,927 respondents aged 16 to 24 years old,
3,228 respondents aged 25 to 34 years old,
2,677 respondents aged 35 to 44 years old,
388 respondents aged 45 to 54 years old,
109 respondents aged 55 years and above.
Figures might not sum up to 100 percent due to the round up.
Citation formats