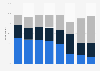
| Characteristic | Number of vacancies |
|---|---|
| 2022 Q4 | 18,074 |
| 2022 Q3 | 16,260 |
| 2022 Q2 | 21,133 |
| 2022 Q1 | 26,076 |
| 2021 Q4 | 18,381 |
| 2021 Q3 | 20,746 |
| 2021 Q2 | 20,907 |
| 2021 Q1 | 18,354 |
| 2020 Q4 | 12,071 |
| 2020 Q3 | 15,078 |
| 2020 Q2 | 9,539 |
| 2020 Q1 | 18,197 |
| 2019 Q4 | 14,854 |
| 2019 Q3 | 16,758 |
| 2019 Q2 | 19,242 |
| 2019 Q1 | 23,853 |
| 2018 Q4 | 17,014 |
| 2018 Q3 | 19,034 |
| 2018 Q2 | 23,073 |
| 2018 Q1 | 25,217 |
| 2017 Q4 | 18,263 |
| 2017 Q3 | 17,579 |
| 2017 Q2 | 22,049 |
| 2017 Q1 | 25,487 |
| 2016 Q4 | 16,102 |
| 2016 Q3 | 17,195 |
| 2016 Q2 | 22,410 |
| 2016 Q1b | 21,690 |
| 2015 Q4 | 8,159 |
| 2015 Q3 | 10,408 |
| 2015 Q2 | 19,195 |
| 2015 Q1 | 16,473 |
| 2014 Q4 | 6,931 |
| 2014 Q3 | 9,456 |
| 2014 Q2 | 12,600 |
| 2014 Q1 | 12,616 |
| 2013 Q4 | 5,706 |
| 2013 Q3 | 6,422 |
| 2013 Q2 | 12,819 |
The chart is not accessible to screen readers. Please switch to the table view to access the data.
March 2023
Croatia
2013 Q2 to 2022 Q4
b: Break in time series.
Job vacancy statistics (JVS) provide information on the level and structure of labor demand. Eurostat publishes quarterly data on the number of job vacancies and the number of occupied posts which are collected under the JVS framework regulation and the two implementing regulations: the implementing regulation on the definition of a job vacancy, the reference dates for data collection, data transmission specifications and feasibility studies, as well as the implementing regulation on seasonal adjustment procedures and quality reports. Eurostat disseminates also the job vacancy rate which is calculated on the basis of the data provided by the countries.
Eurostat publishes also the annual data which are calculated on the basis of the quarterly data.
The data for this statistic has been extracted from Eurostat using the Code JVS_Q_ISCO_R2