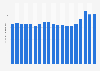
| Characteristic | Percentage change in prices year-over-year |
|---|---|
| - | - |
| - | - |
| - | - |
| - | - |
| - | - |
| - | - |
| - | - |
| - | - |
| - | - |
| - | - |
| - | - |
| - | - |
| - | - |
| - | - |
| - | - |
| - | - |
| - | - |
| - | - |
| - | - |
| - | - |
| - | - |
| - | - |
| - | - |
| - | - |
| - | - |
| - | - |
| - | - |
| - | - |
| - | - |
| - | - |
| - | - |
| - | - |
| - | - |
| - | - |
| - | - |
| - | - |
| - | - |
| - | - |
| - | - |
| - | - |
| - | - |
The chart is not accessible to screen readers. Please switch to the table view to access the data.
Download
Source
Sources
Release date
August 2022
More information
Region
United Kingdom
Survey time period
April 2019 to August 2022
Supplementary notes
The source makes the following commentary regarding the methodology used in the statistic.
"The BRC-Nielsen Shop Price Index (SPI) measures price changes within a basket of both Food and Non-Food items. The SPI is administered by Nielsen, who collate and analyse the data on behalf of the BRC. The index provides an indicator of the direction of price changes in retail outlets. The BRC launched the Shop Price Index to give an accurate picture of the inflation rate of 500 of the most commonly bought high street products in stores."
Citation formats