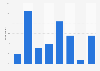
| Characteristic | Number of disruptions |
|---|---|
| - | - |
| - | - |
| - | - |
The chart is not accessible to screen readers. Please switch to the table view to access the data.
Download
Source
Source
Release date
January 2022
More information
Region
Worldwide
Survey time period
2019 to 2021
Supplementary notes
Data is gathered from the source鈥檚 EventWatch AI, a 24/7 global event monitoring service that contextualizes and analyzes more than 1.7 billion news feeds about potential and existing supply chain disruptions from approximately 4.2 million sources in 100 languages, including daily news, government regulatory reports, and social media.
Figures prior to 2021 were taken from previous releases.
Citation formats