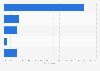
| Characteristic | Share of respondents |
|---|---|
| Comedy | 52.7% |
| News | 38.2% |
| Technology, science | 36.1% |
| Personal development | 35.7% |
| Music | 33.1% |
| Computer, software, IT | 33% |
| Personal development and education | 31.2% |
| Traveling, holidays | 27.5% |
| Politics, economy | 27.3% |
| Medicine, health, healthy lifestyle | 26.2% |
| Gaming | 24.1% |
| Sports | 22.5% |
| Family, partner, children | 20.9% |
| Home and garden | 19.2% |
| Modern life and celebrities | 18.5% |
| Cultural and musical event | 17.9% |
| Culinary recipes and gastronomy | 17.8% |
| Fashion, cosmetics and beauty | 17% |
| Literature | 15.2% |
| Shopping | 14.2% |
| Other | 5% |
The chart is not accessible to screen readers. Please switch to the table view to access the data.
Loading statistic...
Download
Source
Source
Release date
August 2020
More information
Region
Romania
Survey time period
2020
Citation formats