| Characteristic | Share of men |
|---|---|
| - | - |
| - | - |
| - | - |
| - | - |
| - | - |
| - | - |
The chart is not accessible to screen readers. Please switch to the table view to access the data.
Download
Source
Source
Release date
October 2020
More information
Region
Japan
Survey time period
November 2019
Number of respondents
2,669 respondents
Age group
20 years and older
Method of interview
Questionnaire
Supplementary notes
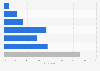
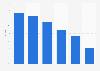
Survey question: "How often do you use periodical public or private food delivery services?"
Data reflects regular periodical consumers with a usage frequency of once a week or more.
Distribution of respondents:
20 to 29 years: 221
30 to 39 years: 254
40 to 49 years: 427
50 to 59 years: 414
60 to 69 years: 564
70 years and older: 789
Citation formats