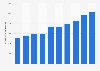
| Characteristic | Pipeline capacity in gigawatts |
|---|---|
| - | - |
| - | - |
| - | - |
| - | - |
| - | - |
| - | - |
| - | - |
| - | - |
| - | - |
| - | - |
| - | - |
The chart is not accessible to screen readers. Please switch to the table view to access the data.
Download
Source
Sources
Release date
August 2021
More information
Region
Worldwide
Survey time period
2020
Special properties
capacity totals exclude contributions from minority corporate shareholdings
Supplementary notes
Light blue figures correspond to power utilities. Dark blue figures correspond to oil companies.
Citation formats