| Characteristic | Bulgaria | Czechia | Estonia | Croatia | Latvia | Lithuania | Hungary | Poland | Romania | Slovenia | Slovakia |
|---|---|---|---|---|---|---|---|---|---|---|---|
| - | - | - | - | - | - | - | - | - | - | - | - |
| - | - | - | - | - | - | - | - | - | - | - | - |
| - | - | - | - | - | - | - | - | - | - | - | - |
| - | - | - | - | - | - | - | - | - | - | - | - |
| - | - | - | - | - | - | - | - | - | - | - | - |
| - | - | - | - | - | - | - | - | - | - | - | - |
| - | - | - | - | - | - | - | - | - | - | - | - |
| - | - | - | - | - | - | - | - | - | - | - | - |
| - | - | - | - | - | - | - | - | - | - | - | - |
| - | - | - | - | - | - | - | - | - | - | - | - |
| - | - | - | - | - | - | - | - | - | - | - | - |
| - | - | - | - | - | - | - | - | - | - | - | - |
| - | - | - | - | - | - | - | - | - | - | - | - |
| - | - | - | - | - | - | - | - | - | - | - | - |
| - | - | - | - | - | - | - | - | - | - | - | - |
| - | - | - | - | - | - | - | - | - | - | - | - |
The chart is not accessible to screen readers. Please switch to the table view to access the data.
March 2025
Central and Eastern Europe
2009 to 2023
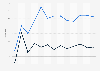
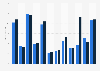
For most recent GDP data, Gross domestic product (GDP) is a measure for the economic activity. It is defined as the value of all goods and services produced less the value of any goods or services used in their creation. The volume index of GDP per capita in Purchasing Power Standards (PPS) is expressed in relation to the European Union average set to equal 100. If the index of a country is higher than 100, this country's level of GDP per head is higher than the EU average and vice versa. Basic figures are expressed in PPS, i.e. a common currency that eliminates the differences in price levels between countries allowing meaningful volume comparisons of GDP between countries. Please note that the index, calculated from PPS figures and expressed with respect to EU27_2020 = 100, is intended for cross-country comparisons rather than for temporal comparisons.
*Provisional