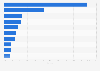
| Characteristic | Share of product category |
|---|---|
| - | - |
| - | - |
| - | - |
| - | - |
| - | - |
The chart is not accessible to screen readers. Please switch to the table view to access the data.
Download
Source
Source
Release date
November 2020
More information
Region
Australia
Survey time period
Moving annual total to October 4th, 2020
Supplementary notes
Results based on the IRI MarketEdge Retail Liquor Weighted.
Citation formats