

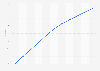
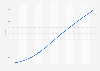

| Characteristic | 2017 | 2018 | 2019 | 2020 | 2021** |
|---|---|---|---|---|---|
| - | - | - | - | - | - |
| - | - | - | - | - | - |
| - | - | - | - | - | - |
| - | - | - | - | - | - |
| - | - | - | - | - | - |
| - | - | - | - | - | - |
| - | - | - | - | - | - |
The chart is not accessible to screen readers. Please switch to the table view to access the data.
Download
Source
More information
Region
Worldwide
Survey time period
2017 to 2021
Special properties
cumulative figures*
Supplementary notes
* The product volume in a given year adds up the number of products dropshipped in previous years. The figure for 2017 includes the dropshipping volume of previous years.
** As of April 14, 2021.
A sample of 3.5 million products from over 300 thousand shops was randomly chosen and analyzed, based on data for more than 600 thousand shops across various dropshipping services.
The term "Dropshipping products" indicates the products which are fulfilled through the Shopify's third-party fulfillment service API or from a Shopify application. Manually dropshipped products by retailers are not included as dropshipping products.
Citation formats



