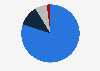
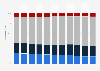
| Characteristic | Primary sector: agriculture, forestry, fishery | Secondary sector: production industry | Tertiary sector: services, other industries |
|---|---|---|---|
| 2024 | 1.2% | 23.3% | 75.5% |
| 2023 | 1.2% | 23.5% | 75.3% |
| 2022 | 1.2% | 23.6% | 75.2% |
| 2021 | 1.2% | 23.8% | 74.9% |
| 2020 | 1.3% | 24% | 74.7% |
| 2019 | 1.3% | 24.1% | 74.5% |
| 2018 | 1.4% | 24.1% | 74.5% |
| 2015 | 1.5% | 24.4% | 74.1% |
| 2010 | 1.6% | 24.5% | 73.9% |
| 2005 | 1.7% | 25.7% | 72.6% |
| 2000 | 1.9% | 28.5% | 69.6% |
| 1995 | 2.3% | 32% | 65.8% |
| 1990 | 3.5% | 36.6% | 59.9% |
| 1985 | 4.4% | 38.1% | 57.5% |
| 1980 | 5.1% | 41.1% | 53.8% |
| 1975 | 6.6% | 42.4% | 51% |
| 1970 | 8.4% | 46.5% | 45.1% |
| 1965 | 10.7% | 49.2% | 40.1% |
| 1960 | 13.7% | 47.9% | 38.3% |
| 1955 | 18.5% | 47.1% | 34.4% |
| 1950 | 24.6% | 42.9% | 32.5% |
The chart is not accessible to screen readers. Please switch to the table view to access the data.
Loading statistic...
Download
Source
Source
Release date
January 2025
More information
Region
Germany
Survey time period
1950 to 2024
Special properties
Domestic concept
Supplementary notes
The figures refer to the results of calculating the number of employees within the framework of total national economic calculaions.
Figures based on the domestic concept, i.e. the numbers refer to people with a place of work in Germany.
1950 to 1969: classification of economic industries, issue 1979 (WZ1979).
1970 to 1990: classification of economic industries, issue 2008 (WZ2008).
Previous federal territory until 1990. 1950 to 1959 without Berlin and Saarland.
Citation formats