
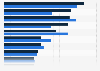


| Characteristic | Share of respondents |
|---|---|
| - | - |
| - | - |
| - | - |
| - | - |
| - | - |
| - | - |
| - | - |
| - | - |
The chart is not accessible to screen readers. Please switch to the table view to access the data.
Download
Source
Source
Release date
April 2021
More information
Region
Europe, United States
Survey time period
November 2020 to January 2021
Number of respondents
6,042 respondents
Special properties
based on a survey of executives, departmental heads, IT managers and other key professionals
Supplementary notes
Drawn from a representative sample of 6,042 organisations across eight countries by size and sector (1,000 plus each from the USA, UK, France and Germany; more than 500 each from Belgium, Spain and The Netherlands; and 300 plus from the Republic of Ireland)
Respondents chose all that applied.
Citation formats



