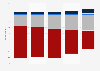
| Characteristic | Significantly increase | Slighlty increase | Slightly decrease | Significantly decrease |
|---|---|---|---|---|
| - | - | - | - | - |
| - | - | - | - | - |
| - | - | - | - | - |
| - | - | - | - | - |
| - | - | - | - | - |
The chart is not accessible to screen readers. Please switch to the table view to access the data.
Download
Source
Source
In cooperation with
McKinsey & Company
Release date
September 2020
More information
Region
Japan
Survey time period
May 9, 2020 to September 4, 2020
Number of respondents
5,000 respondents
Age group
18 years and older
Method of interview
Online survey
Supplementary notes
* Waves represent the different number of phases in which respondents were conducting the surveys.
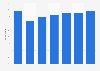
Question: Given TODAY鈥橲 situation, how has your mobility changed since the outbreak of COVID 19?
Citation formats