| Characteristic | Percent trust in each source |
|---|---|
| - | - |
| - | - |
| - | - |
The chart is not accessible to screen readers. Please switch to the table view to access the data.
February 2021
United Kingdom
February 3 to 12, 2021
1,007 respondents
18 years and older
Online interview
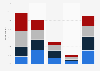
The survey included a sample of 2,014 respondents who were representative of the general population in the United Kingdom. The statements in the chart refer to responses gathered from half the sample. The questions and answers were as follows:
Specifically, how much do you worry about each of the following? 'Journalists and reporters are purposely trying to mislead people by saying things they know are false or gross exaggerations': 9-point scale; top 4 box, worry.
Below is a list of statements. For each one, please rate how much you agree or disagree with that statement. 'Most news organisations are more concerned with supporting an ideology or political position than with informing the public'. 9-point scale; top 4 box, agree.
How well do you feel the media is currently doing each of the
following? 'The media is not doing well at being objective and nonpartisan'. 5-point scale; bottom 3 box, not doing well.