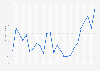
| Characteristic | Index points |
|---|---|
| Jul 2023 | 52.1 |
| Jun 2023 | 52.6 |
| May 2023 | 53.5 |
| Apr 2023 | 52.6 |
| Mar 2023 | 53.2 |
| Feb 2023 | 53.6 |
| Jan 2023 | 52.6 |
| Dec 2022 | 53 |
| Nov 2022 | 53.2 |
| Oct 2022 | 50.7 |
| Sep 2022 | 52 |
| Aug 2022 | 51.7 |
| Jul 2022 | 50.3 |
| Jun 2022 | 50.9 |
| May 2022 | 50.8 |
| Apr 2022 | 48.2 |
| Mar 2022 | 44.1 |
| Feb 2022 | 48.6 |
| Jan 2022 | 51.8 |
| Dec 2021 | 51.6 |
| Nov 2021 | 51.7 |
| Oct 2021 | 51.6 |
| Sep 2021 | 49.8 |
| Aug 2021 | 46.5 |
| Jul 2021 | 47.5 |
| Jun 2021 | 49.2 |
| May 2021 | 51.9 |
| Apr 2021 | 50.4 |
| Mar 2021 | 51.1 |
| Feb 2021 | 51.5 |
| Jan 2021 | 50.9 |
| Dec 2020 | 49.7 |
| Nov 2020 | 46.3 |
| Oct 2020 | 46.9 |
| Sep 2020 | 48.9 |
| Aug 2020 | 51.1 |
| Jul 2020 | 48.4 |
| Jun 2020 | 49.4 |
| May 2020 | 36.2 |
| Apr 2020 | 31.3 |
| Mar 2020 | 47.5 |
| Feb 2020 | 48.2 |
| Jan 2020 | 47.9 |
The chart is not accessible to screen readers. Please switch to the table view to access the data.
Zoomable Statistic: Select the range in the chart you want to zoom in on.
Loading statistic...
Download
Source
Sources
Release date
August 2023
More information
Region
Russia
Survey time period
January 2020 to July 2023
Supplementary notes
The index ranges between 0 and 100, with values above 50 referring to an expansion from the previous month and values below 50 indicating a contraction. The value of 50 represents no change.
The PLI manufacturing survey covers the following economic indicators: output, new orders, new export orders, backlogs of work, output prices, input prices, suppliers鈥� delivery times, stocks of finished goods, quantity of purchases, stocks of purchases, employment, and future output.
Release date is the date of access.
Citation formats