| Characteristic | Pharmaceutical price index |
|---|---|
| - | - |
| - | - |
| - | - |
| - | - |
| - | - |
| - | - |
| - | - |
| - | - |
| - | - |
| - | - |
| - | - |
| - | - |
| - | - |
| - | - |
| - | - |
| - | - |
| - | - |
| - | - |
| - | - |
| - | - |
| - | - |
| - | - |
| - | - |
| - | - |
| - | - |
| - | - |
| - | - |
| - | - |
| - | - |
| - | - |
| - | - |
| - | - |
| - | - |
| - | - |
| - | - |
| - | - |
| - | - |
| - | - |
| - | - |
| - | - |
| - | - |
| - | - |
| - | - |
| - | - |
| - | - |
| - | - |
| - | - |
| - | - |
The chart is not accessible to screen readers. Please switch to the table view to access the data.
May 2023
Russia
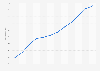
January 2019 to December 2022
Base month January 2019 = 100%.
The index demonstrates pharmaceuticals' price inflation, based on data on real prices and real consumption of obtained medications using the Romir Scan Panel of households.
The index included 67 medications from the most popular categories.
The Romir Scan Panel was based on consumption data from 40,000 survey participants, 15,000 households in 220 cities with a population of 10 thousand or more, representing the purchasing and consumer behavior of residents of Russian cities.
Panel participants scanned QR codes from receipts. The online scan data were entered into the scan panel database.
Release date is the date of access.