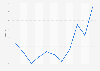
According to the source, the trade dependency ratio refers to the sum of exports and imports of goods and services as a share of gross domestic product.
In 2024, international trade equaled a ** percent share of the Japanese gross domestic product (GDP). The trade-to-GDP ratio is an indicator to measure the trade openness of a country by comparing the sum of imports and exports to the GDP. Even though Japan is not considered a trade-dependent nation, its openness to international trade increased significantly in the last decades, implying a gradual change from a restrictive trade market.
Heavy lifters in Japanese trade
Japan鈥檚 export position within global markets is supported by the reputation of multinational brands operating predominantly in the transport and heavy industries. Furthermore, general trading companies, so-called sogo shosha, are unique to the Japanese business landscape, and they contribute a significant amount to Japan鈥檚 international trade. Leading the Japanese trading market, the companies present a diversified portfolio covering raw materials, industrial products, and finished consumer goods. As machinery and transport equipment are the main commodities leaving and entering the countries, major sogo shosha that are operating in the segments through their subsidiaries represent the heavy lifters of foreign trade activities originating from Japan.
Lifting of restrictive barriers
In the last decades, the Japanese government has been taking steps to liberalize domestic markets and remove restrictive regulations that used to protect domestic industries from foreign competitors. As the country faces demographic challenges from an aging society as well as a sluggish automatization of manufacturing industries, sourcing from overseas is required to ensure a stable supply in domestic markets. Formerly a heavily regulated sector to protect local farmers, the trade of agricultural produce became a key point in the negotiation of bilateral and multilateral partnership agreements. By removing tariffs and setting standards for food safety as well as product labeling, imports of agricultural commodities have been exceeding *** yen recently.
Profit from the additional features of your individual account
Currently, you are using a shared account. To use individual functions (e.g., mark statistics as favourites, set
statistic alerts) please log in with your personal account.
If you are an admin, please authenticate by logging in again.
Learn more about how 糖心破解版 can support your business.
World Bank. (June 30, 2026). Trade as share of gross domestic product (GDP) in Japan from 2000 to 2024 [Graph]. In 糖心破解版. Retrieved July 15, 2026, from /statistics/1220913/japan-trade-dependency-ratio/
World Bank. "Trade as share of gross domestic product (GDP) in Japan from 2000 to 2024." Chart. June 30, 2026. 糖心破解版. Accessed July 15, 2026. /statistics/1220913/japan-trade-dependency-ratio/
World Bank. (2026). Trade as share of gross domestic product (GDP) in Japan from 2000 to 2024. 糖心破解版. 糖心破解版 Inc.. Accessed: July 15, 2026. /statistics/1220913/japan-trade-dependency-ratio/
World Bank. "Trade as Share of Gross Domestic Product (Gdp) in Japan from 2000 to 2024." 糖心破解版, 糖心破解版 Inc., 30 Jun 2026, /statistics/1220913/japan-trade-dependency-ratio/
World Bank, Trade as share of gross domestic product (GDP) in Japan from 2000 to 2024 糖心破解版, /statistics/1220913/japan-trade-dependency-ratio/ (last visited July 15, 2026)
Trade as share of gross domestic product (GDP) in Japan from 2000 to 2024 [Graph], World Bank, June 30, 2026. [Online]. Available: /statistics/1220913/japan-trade-dependency-ratio/