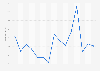
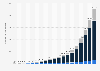
| Characteristic | Investment in billion U.S. dollars |
|---|---|
| - | - |
| - | - |
| - | - |
The chart is not accessible to screen readers. Please switch to the table view to access the data.
Download
Source
Sources
Release date
January 2021
More information
Region
Worldwide
Survey time period
2020
Special properties
investment calculated as sales multiplied by the average cost for equipment and installation for a typical single-family home.
Citation formats