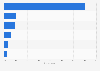
| Characteristic | Share of respondents |
|---|---|
| - | - |
| - | - |
| - | - |
| - | - |
| - | - |
| - | - |
| - | - |
| - | - |
| - | - |
| - | - |
| - | - |
| - | - |
| - | - |
| - | - |
| - | - |
| - | - |
| - | - |
| - | - |
| - | - |
The chart is not accessible to screen readers. Please switch to the table view to access the data.
Download
Source
Source
In cooperation with
McKinsey & Company
Release date
December 2020
More information
Region
India
Survey time period
November 9 to 20, 2020
Number of respondents
1,091 respondents
Age group
18 years and older
Supplementary notes
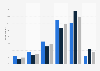
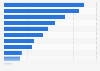
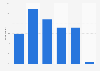
Survey question: "How worried would you be if you were to do the following activities in the next two weeks?"
Level of concern is calculated by subtracting the share of respondents stating they are "not worried at all" and "not very worried" from "very worried " and "extremely worried".
Citation formats