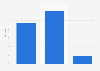
| Characteristic | Share of respondents |
|---|---|
| Furloughs | 48.63% |
| Layoffs | 42.41% |
| Reduction of work hours | 47.22% |
| Salary reduction | 47.08% |
| Changes to future hiring | 43.08% |
| No workforce changes | 7.85% |
| Not applicable | 4.15% |
| Other | 7.11% |
The chart is not accessible to screen readers. Please switch to the table view to access the data.
Loading statistic...
Download
Source
Sources
Release date
September 2020
More information
Region
Worldwide
Survey time period
August 23 to September 7, 2020
Number of respondents
1,350 respondents
Special properties
Live music industry professionals*
Supplementary notes
* The survey respondents represented a cross-section of the live music industry. According to the source, respondents included 24 percent from the venue business, 17.4 percent promoters and talent buyers, 16 percent production/concert support services, and approximately 10 percent were ticketers, agents, or managers respectively. Another 11 percent were 'other', often hybrid, titles (e.g. Owner/Talent Buyer/Promoter). The origin of respondents was not specified.
Citation formats